1
2
3
4
5
6
7
8
9
10
11
12
13
14
15
16
17
18
19
20
21
22
23
24
25
26
27
28
| !P.MULTI=[0,2,0,0,0] ;告诉IDL在同一幅图上划分为几个区域画图,此处划分为2行
set_plot, 'PS' ;打开设备
device,xsize=21 ;设置图片大小
device,ysize=31
tvlct, [70,255,0], [70,255,255], [70,0,0], 1 ;此处为自定义颜色表,可以在下面的代码中绘制不同颜色的图
device, Color=1 ;设置当前PS设备的颜色表为 1
device, FILE='project_model.eps', /ENCAPSULATED ;命名文件名
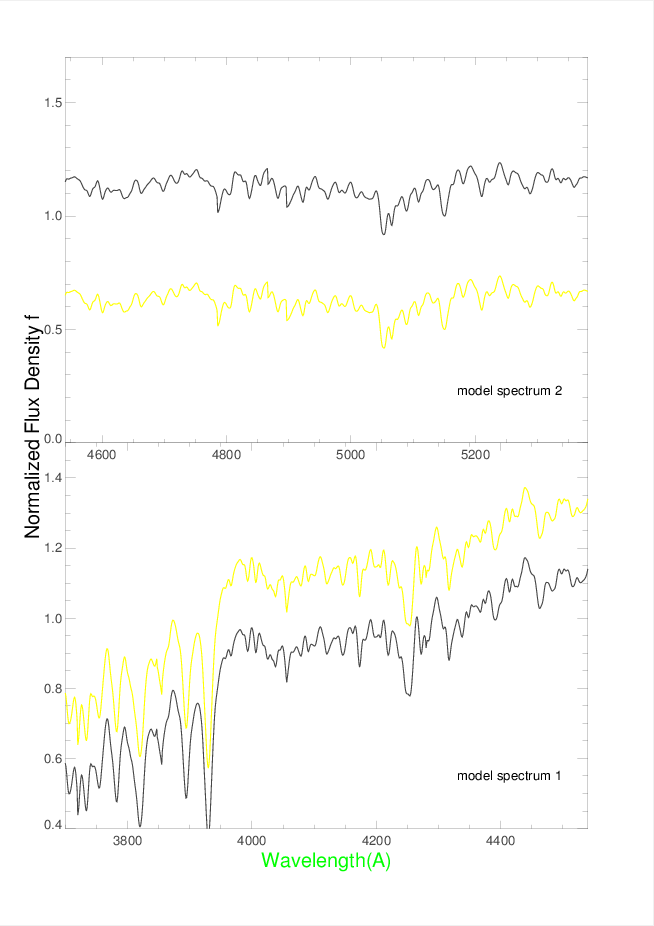
;model 1 ;绘制图片1
;此处加上了/nodata后,并不会将数据绘制与图上,但是其他设置仍然会生效。Xrange与Yrange设置x轴和y轴的范围,xstyle和ystyle为两坐标轴的
;的显示细节,position为限制整张图片的位置position=[x0,y0,x1,y1],(x0,y0)为图片的左下角,(x1,y1)为图片右上角。此处使用的是归一化的左
;标。xyouts为在归一化坐标下载图片上显示字符。oplot使用在plot下,为在一张图上继续绘图。thick为绘图线条的粗细,color为绘图颜色。
;
plot,wave,model,Thick=3,XRange=[3700,4540],YRange=[0.4,1.5],xstyle=1,ystyle=1,/nodata,position=[0.1,0.1,0.9,0.5],color=1
XYouts,0.7,0.15,'model spectrum 1',/Normal
oplot,wave,model,Thick=3,color=2
oplot,wave,model+0.3,Thick=3,color=2
;model 2
plot,wave,model,Thick=3,XRange=[4541,5381],YRange=[0.0,1.7],xstyle=1,ystyle=1,/nodata,position=[0.1,0.5,0.9,0.9],color=1
XYouts,0.7,0.55,'model spectrum 2',/Normal
oplot,wave,model,Thick=3,color=2
oplot,wave,model+0.2,Thick=3,color=2
;!p.font设置字体,charsize设置字体大小,Orientation为输入的字符旋转度数
!p.font=4
XYOuts, 0.06, 0.4,'Normalized Flux Density f',/Norm,Charsize=1.5,Orientation=90
XYOuts, 0.4, 0.06, /Normal,'Wavelength(A)', Charsize=1.5,color=3
device, /CLOSE_FILE
device,ENCAPSULATED=0
|